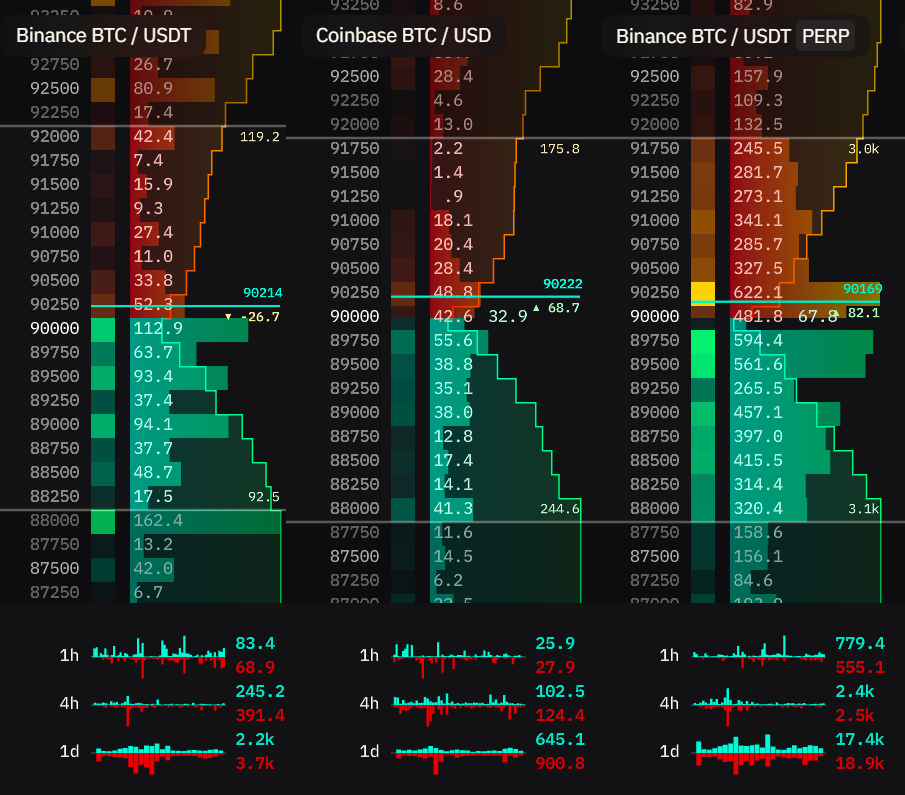
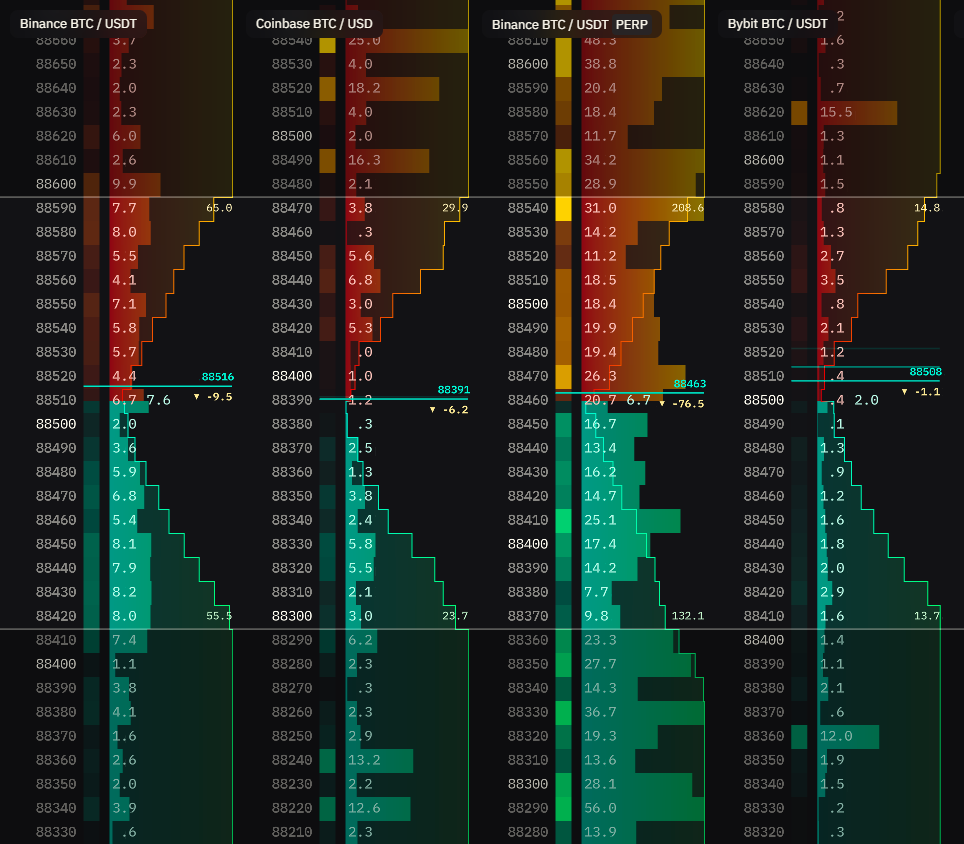
The Order Book widget displays all active buy and sell orders for selected markets in real-time. You see price levels and order sizes visualized as a heatmap, allowing you to quickly assess liquidity distribution across the market.
Market Compatibility
The Order Book widget supports multiple markets with the same base and quote currencies.
Compatible:
- BTC/USDT (Binance) + BTC/USDT (Coinbase) - same pair, different exchanges
- BTC/USDT + BTC/USDC - same base, similar quote
- BTC/USDT (Spot) + BTC/USDT:PERP - compare spot and perpetual
Incompatible:
- BTC/USDT + ETH/USDT - different base currencies
- BTC/USDT + BTC/BNB - different quote currencies
This widget is designed for comparing liquidity of the same asset across venues. For monitoring different pairs, use the Watchlist widget.
Interface
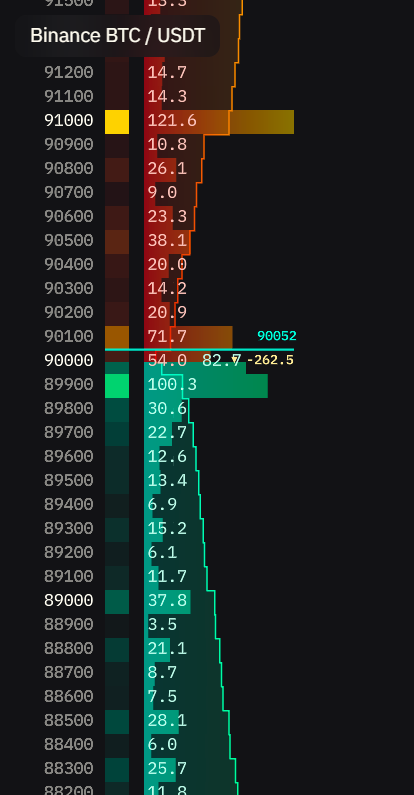
See where the real money sits. The Order Book shows every active buy and sell order in real-time, with color-coded heatmaps highlighting the largest positions.
Asks (sell orders) stack above the current price. Bids (buy orders) sit below. Scan vertically to spot liquidity walls, gaps, and where major players are positioned.
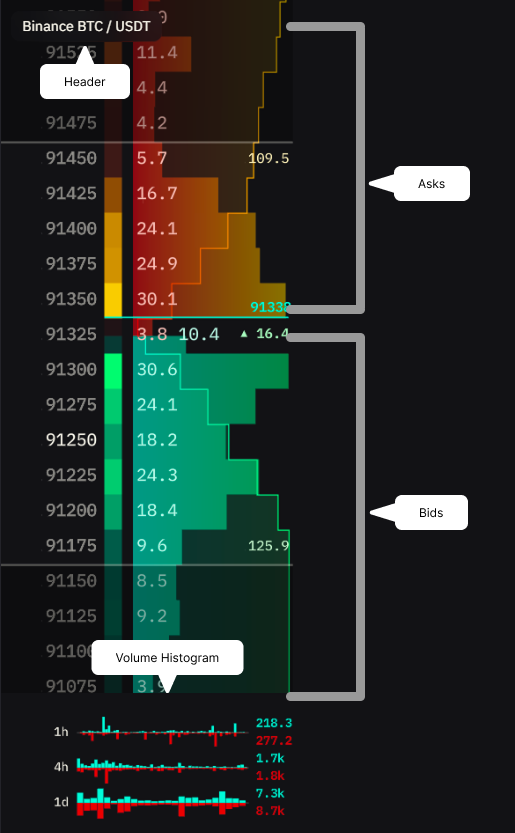
Header
Shows trading pair and exchange name for each order book.
Single market: Displays exchange and trading pair (e.g., “Binance BTC / USDT”)
Aggregated markets: Single header showing “Aggregated X markets” with list of included exchanges
Depth Ladder
Turn on Depth ladder to draw one line above the mid (asks) and one below (bids). Each line shows the cumulative amount from the best level out to the line, and its distance from the mid in %. Aggregated columns sum their markets. Press D to show or hide the ladder.
The ladder has two modes. Switch between them with the Ladder setting or Shift + D. With the ladder off, Shift + D turns it on in Ruler mode.
Auto: Lines step through round depths as you zoom. Nothing to set.
Ruler: One band at a fixed percentage from the mid, the same in every column. Use it to compare how much size sits within the same distance on different pairs.
What the ruler controls:
- Dimming - Everything outside the band is dimmed.
- Heatmap color intensity - The largest order inside the band gets maximum brightness. All others scale proportionally. Rows outside the band are still drawn but don’t affect scaling.
- Volume bar width - The largest order inside the band gets maximum width. All others scale proportionally.
- Depth imbalance - With Show depth imbalance on, the lines also show the difference between bid and ask volume inside the band.
Why this matters: Pull the band close to the mid to examine nearby liquidity in detail. Push it wider to see overall market structure and distant order walls.
Order Book Grid
The main display area showing all active orders separated by current price.
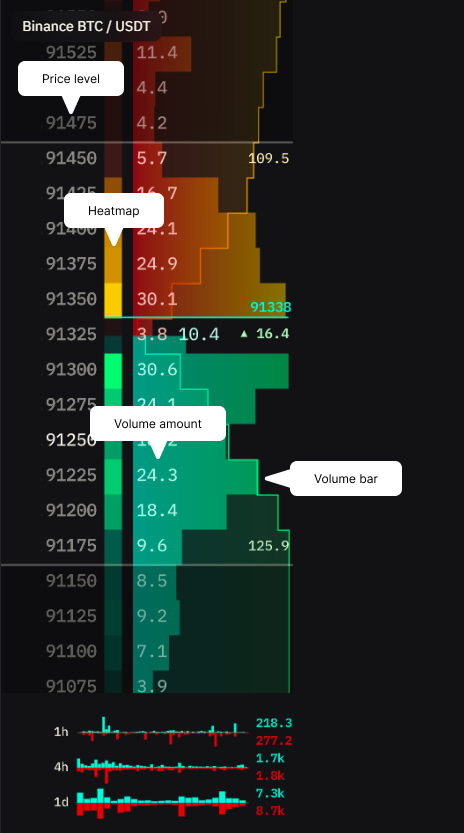
Each row displays:
- Price level - Order price, grouped by Grouping setting
- Heatmap bar - Color intensity scaled to the ruler band in Ruler mode. Brighter = larger order within the band
- Volume amount - Exact order size at this price level
- Volume bar - Visual length scaled to the ruler band in Ruler mode for quick comparison
Current Price & Depth Delta
Separator line between bid and ask sides showing last traded price. With Show depth imbalance on, the depth ladder shows a delta value: the difference between cumulative bid and ask liquidity at the ladder lines.
Reading the delta:
- Positive (↑) = more resting bid orders than ask orders within the ladder lines
- Negative (↓) = more resting ask orders than bid orders within the ladder lines
What this tells you: Reveals orderbook imbalance within the ladder lines. Large positive delta means stronger passive buy support. Large negative means stronger passive sell resistance.
Note: This shows the imbalance between resting orders in the order book, not executed trade volume. It’s an orderbook depth metric, not a volume delta.
Interactions
Hover States
Hover over any price level: Displays cumulative volume from current price to that level on the right side.
- Bid side cumulative = support strength
- Ask side cumulative = resistance strength
- Higher values = stronger liquidity concentration
Rearranging Order Books
Drag order book headers left/right to reorder when displaying multiple exchanges.
How to use:
- Hover over order book header
- Click and drag left/right
- Drop in new position
Adjusting the Ruler
In Ruler mode, drag either line to change the band.
How to use:
- Hover over a line in any column. The cursor turns to a resize cursor
- Click and drag it up or down
- Both lines move together, in every column
- To go further, hold the drag at the top or bottom edge. The book scrolls so the band keeps growing
The band is saved when you release.
What changes:
- Heatmap intensity and bar width: Rescale to the largest order inside the new band, even if a larger order exists outside it.
- Line labels: Update to the cumulative amount and % at the new position.
Starting point: The first time you switch to Ruler, the band starts at the depth the Auto ladder was showing, or 1% if it wasn’t showing one. After that, Ruler comes back to the band you last set.
Regrouping and zooming: The band keeps its percentage. Pins work in both modes.
Tip: Keep the band narrow to examine nearby liquidity in detail. Widen it to see overall market structure.
Quick Grouping Adjustment
Change grouping precision by dragging price level rows up (larger) or down (smaller).
How to use:
- Hover over a price level row
- Click and drag up/down
- Grouping adjusts in real-time
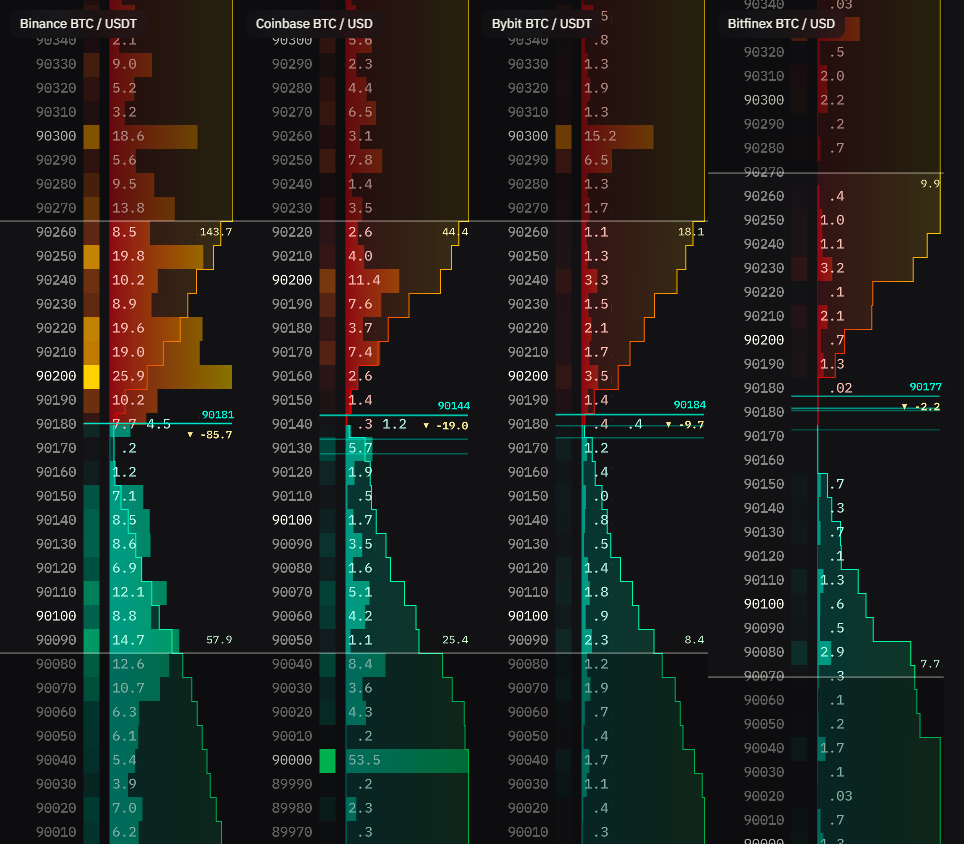
Market Aggregation
Combine order books from multiple exchanges into one aggregated view. Only spot markets can be aggregated—derivatives cannot be mixed due to different mechanics.
How to aggregate:
- Add multiple spot markets to the widget
- Hover over market header
- Click aggregation button
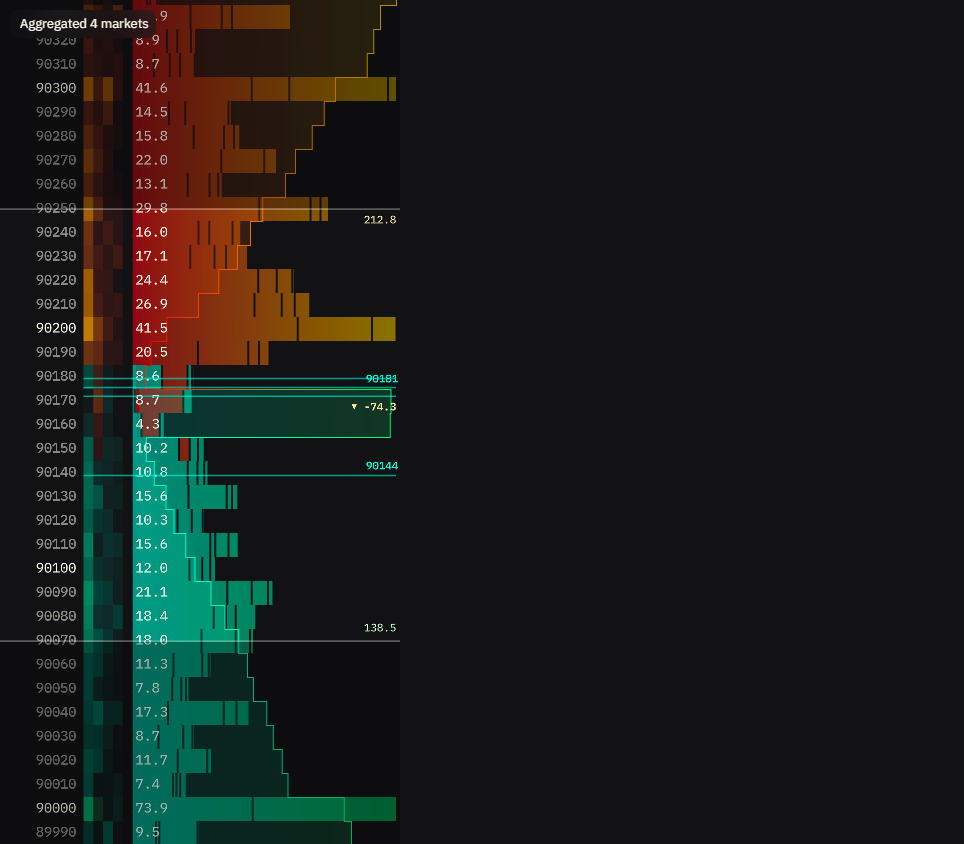
Result: Price levels align and volumes sum together. Heatmap shows total liquidity across all exchanges.
| Before Aggregation | After Aggregation |
|---|---|
 |  |
To unaggregate:
- Full: Click on aggregated header
- Individual: Click next to exchange name
Restrictions:
- Only spot markets can be aggregated together
- Cannot mix spot + derivatives (different mechanics)
- Cannot mix different trading pairs
Tip: To compare spot and derivatives, display them side-by-side instead of aggregating.
Settings
Grouping
Combines nearby price levels into one row. Lower value = more detail, higher value = broader view.
How it works:
TapeSurf automatically sets the default grouping based on the coin’s current price when you add a market. The dropdown provides approximately 20 options (9 levels below, 11 levels above).
Orders are grouped by rounding down to the nearest grouping value. With grouping set to 100:
- Orders at 1050, 1075, 1099 → grouped into 1000
- Orders at 1100, 1150, 1199 → grouped into 1100
Note: This uniform grouping system ensures accurate aggregation across exchanges but may display price levels differently than individual exchange websites, which often use exchange-specific schemes.
Align Orderflow By
Determines how order books from different exchanges align vertically when displaying multiple order books side-by-side.
Options:
None:
- No alignment, each order book scrolls independently
- Use when monitoring exchanges separately
- Best when you don’t need to compare exact price levels
Center:
- Aligns order book by the midpoint between best bid and best ask
- Centers view on the middle of the spread
- Static alignment that doesn’t follow price movements
Last Price:
- Aligns and centers the order book visualization around the last traded price
- Automatically keeps the most recent trade price fixed at center of view
- Chart scrolls to follow price action in real-time
- Useful for active monitoring and staying focused on current market activity
Levels:
- Aligns by the price level with the smallest spread (tightest bid-ask)
- Centers on the median of best bid/ask prices across all markets
- Provides stable alignment based on order book depth rather than trade activity
- Default and recommended for most use cases
When to use:
- Levels (default) - For most use cases, provides stable alignment by order book depth
- Last Price - For active trading and real-time monitoring, keeps current price always visible
- Center - For balanced comparison of overall liquidity distribution
- None - When you want each order book to scroll independently
Heatmap Mode
Controls how heatmap colors and bar sizes are calculated.
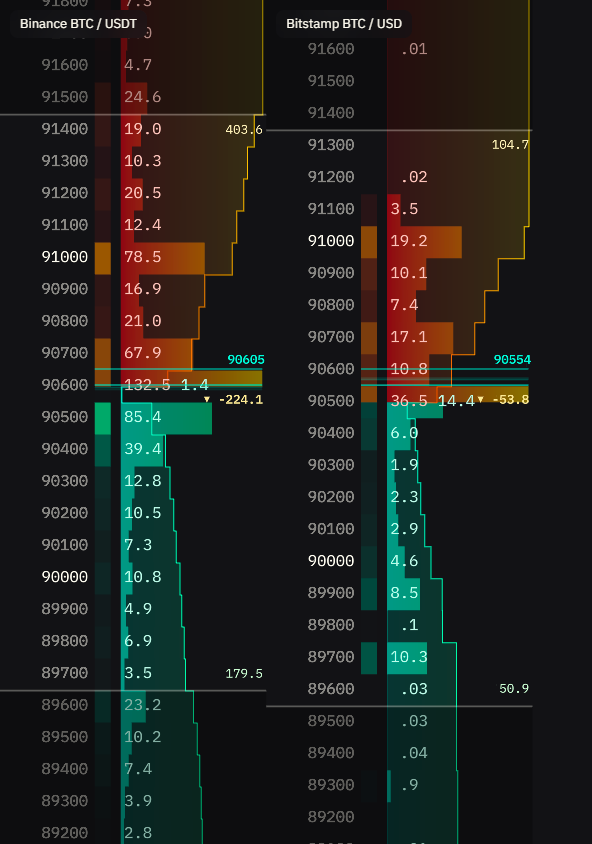
Cross Exchange:
- Compares all exchanges together
- Shows which exchange has largest orders
- Use for cross-exchange liquidity comparison
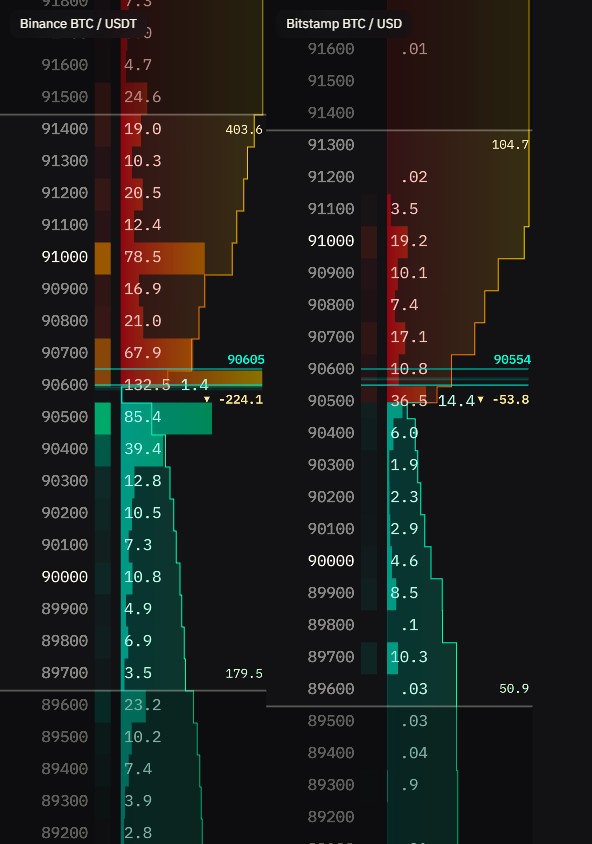
Individual:
- Each exchange calculated independently
- Shows distribution within each exchange
- Use for side-by-side exchange analysis
| Cross Exchange | Individual |
|---|---|
 |  |
When to use:
- Cross Exchange: Best for identifying which exchange has the most liquidity at specific price levels. All order books use same color scale.
- Individual: Best when each exchange should show its own liquidity distribution independently. Each order book has its own color scale.
Turbo Mode
Increases update speed at the cost of higher CPU usage.
When to use:
- ON: Volatile markets, powerful computer
- OFF: Normal conditions, conserving resources
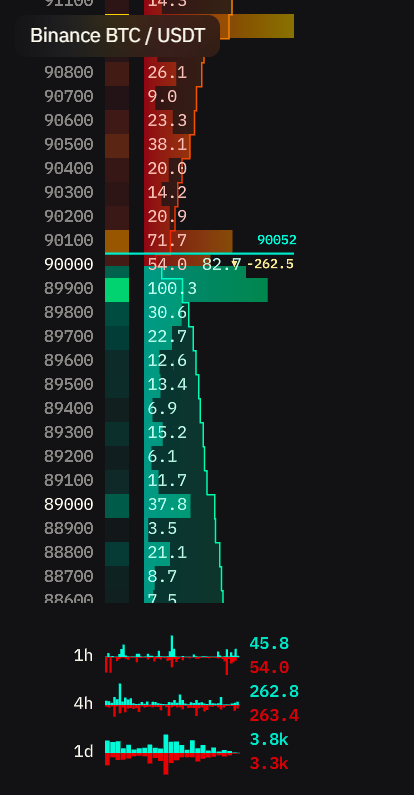
Show Volume Histogram
Shows historical trading volume chart (1h/4h/1d views) at the bottom of order book.
When to use:
- ON: Analyze trading patterns, identify volume spikes
- OFF: Save space, focus on current order book
| Volume Histogram ON | Volume Histogram OFF |
|---|---|
 |  |
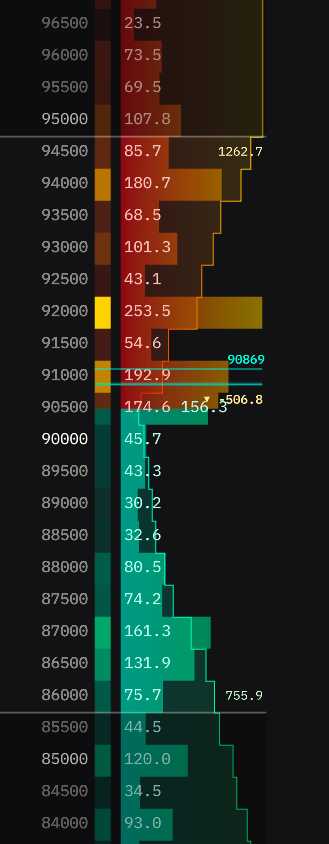
Cumulative (Depth Line)
Shows line visualizing accumulated volume from current price.
- Steep slope = high liquidity concentration
- Flat slope = low liquidity
- Sudden jumps = large order walls
Gradient: Optional color fill under cumulative line (visual enhancement).
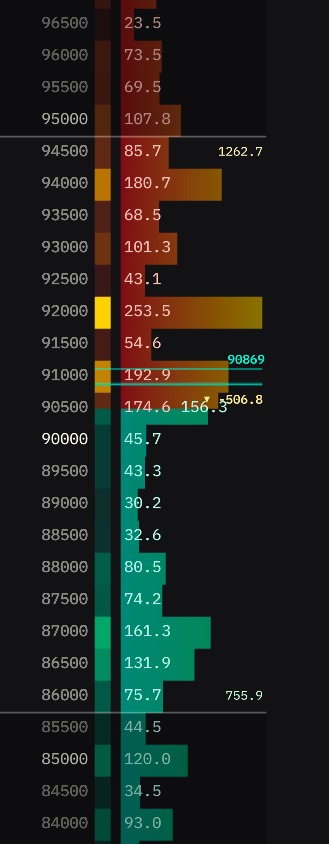
| Cumulative ON (Depth Line) | Cumulative OFF |
|---|---|
 |  |
When to use:
- ON: Visualize total liquidity distribution, identify support/resistance zones, spot large order walls
- OFF: Cleaner view, focus on individual price levels without cumulative overlay
Individual (Order Blocks)
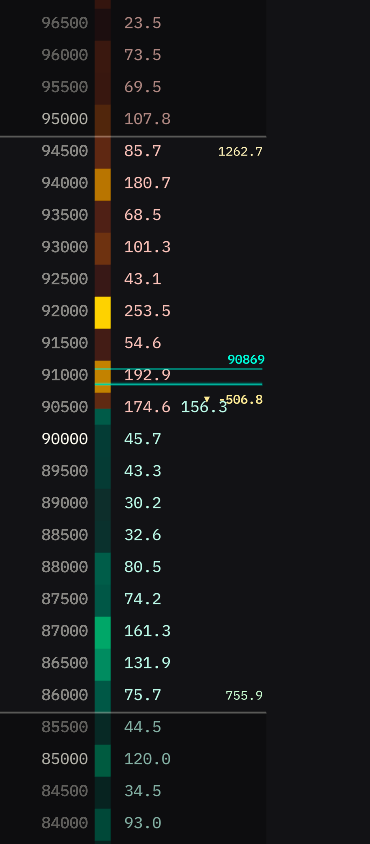
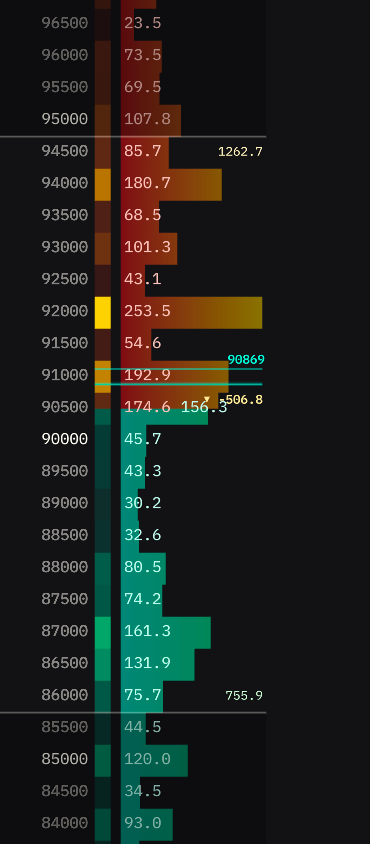
Shows horizontal bars representing order volume at each price level relative to other levels.
How it works:
- ON: Displays horizontal bars showing volume distribution across price levels
- OFF: Shows only price levels and volume numbers without visual bars
| Individual ON (Order Blocks) | Individual OFF (Heatmap) |
|---|---|
 |  |
When to use:
- ON: Visual representation of liquidity distribution, easier to spot large orders and walls at a glance
- OFF: Minimalist view focusing on exact numbers, saves screen space
Dimmed Text
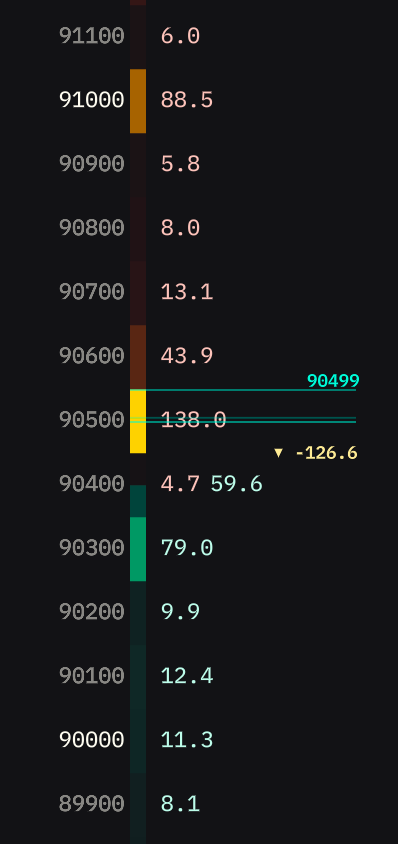
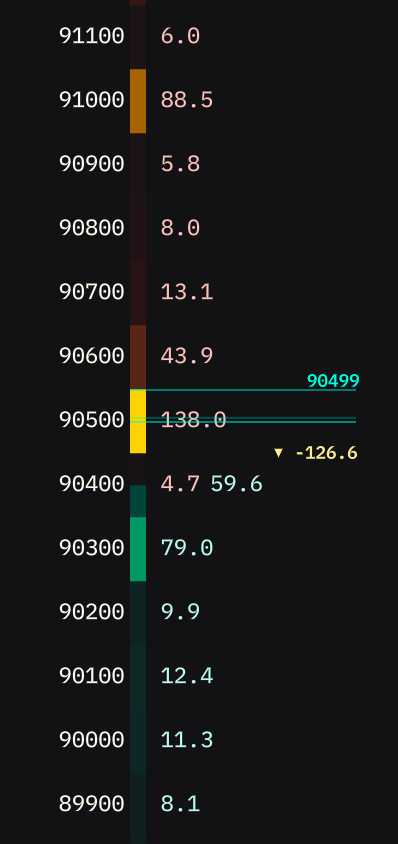
Dims most price numbers while highlighting key price levels based on grouping setting. Makes the heatmap more prominent while maintaining reference points.
How it works:
When enabled, highlights every (grouping × 10) price level:
- Grouping = 1 → highlights every 10 levels (10, 20, 30…)
- Grouping = 10 → highlights every 100 levels (100, 200, 300…)
- Grouping = 100 → highlights every 1000 levels (1000, 2000, 3000…)
| Dimmed Text ON | Dimmed Text OFF (Normal) |
|---|---|
 |  |
When to use:
- ON: Focus on heatmap visualization while keeping key price levels visible for orientation
- OFF: All prices equally readable, better for precise order placement and detailed price analysis
Compact Mode
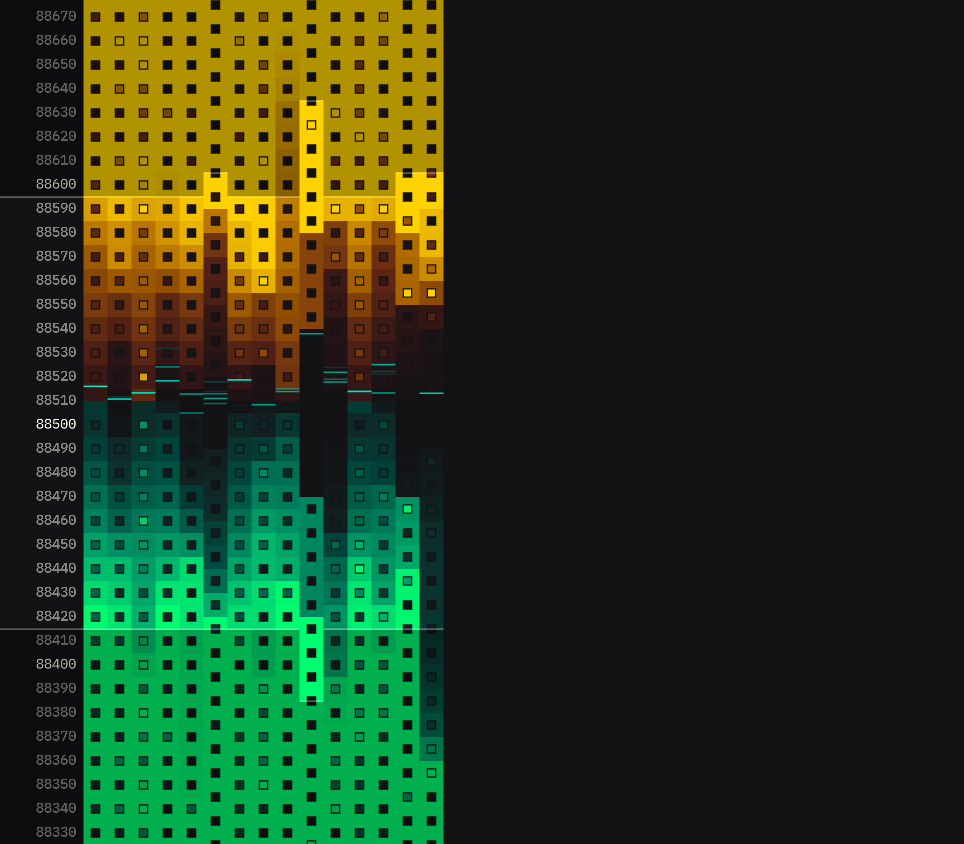
Minimalist view that removes volume numbers and exchange labels to maximize screen space for the heatmap visualization.
Result: Each order book column shrinks to show only price levels and their heatmap bars, allowing you to fit more order books side-by-side or dedicate more space to other widgets.
| Compact Mode ON | Compact Mode OFF |
|---|---|
 |  |
When to use:
- ON: Limited screen space, monitoring multiple exchanges simultaneously, focus on relative liquidity distribution through heatmap
- OFF: Need exact volume numbers for order placement, analyzing specific order sizes, require exchange labels for quick identification
Item Height
Controls row height (10-64px). Lower = more rows visible, higher = easier to read.
Max FPS
Limits screen refresh rate. Higher FPS = smoother updates but more CPU usage.
Note: FPS only affects visual updates. All market data is captured regardless of FPS setting.